

So you’ve discovered Sparklines in Microsoft Excel and now you want to jazz them up? You’ve come to the right place. In my previous post (link here) I outlined what a Sparkline was and how to insert one into your worksheet. Now let’s look at how to customise a sparkline.
Sparkline Tools
Once you have inserted a Sparkline into your worksheet, you will see a new group of tools appear on the Ribbon. The Sparkline Tools > Design tab will allow you to edit various aspects of any Sparkline.
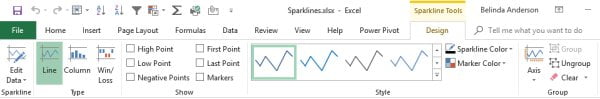
This tab is called a “contextual tab” which means it will only appear on the Ribbon when a Sparkline is selected. Or in other words, it will appear only in the context of what it’s used for. As soon as you select a different cell the tab will disappear from view. This is why I find many people can’t find the tab or remember how to get it back.
One of the nifty features of Sparklines is your ability to create an entire group of them using the AutoFill tool. This is called a Sparkline group and means that any changes you make to one sparkline are automatically applied to all sparklines within the group. Later in this post, I will show you how to ungroup Sparklines which will allow you to edit each individually.
Edit the data included in a Sparkline
Let’s say you’ve included information in your Sparkline you no longer need, or you want to add new data in. Thankfully you can easily add or remove data using the Sparkline Tools > Design tab.
- From the Sparkline Tools > Design tab, click the Edit Data button

- The Edit Sparklines dialog box will appear
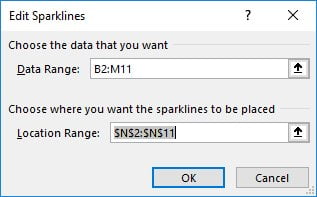
- Make the appropriate changes to either the Data Range or the Location Range as needed
- Click OK
Change the type of Sparkline
If you wish to change the type of sparkline you have selected, you do not need to delete the existing sparkline and start again. You can easily change the Sparkline type between Line, Column and Win/Loss.
- From the Sparkline Tools > Design tab, locate the Type group
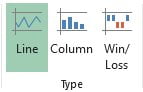
- Change the type to your preferred option
- The Sparkline will update within the cell(s)
Highlight various aspects of a Sparkline
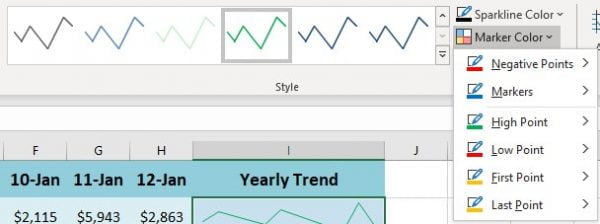
Excel allows you to highlight various points of a Sparkline. This can help to make data stand out and give more definition. Use the Show group to highlight aspects including High Point, Low Point, Negative Points, First and Last Point and all Markers.
- From the Sparkline Tools > Design tab, locate the Show group
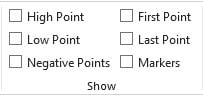
- Place a tick in each option you wish to enable and you will see the Sparkline update automatically
Change the Style of a Sparkline
All Sparklines use a default colour scheme, but let’s be honest, they can be a bit boring. To “jazz up” your Sparkline use the Style gallery to choose a different colour scheme or completely customise the Sparkline and/or Marker colours.
- From the Sparkline Tools > Design tab, locate the Style group
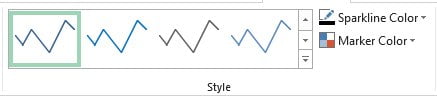
- You can scroll through the Style gallery using the arrows or use the Sparkline Color to choose a custom colour
- You can also customise the colour of the markers which are displayed from the Show group using the Marker Color drop-down gallery
- Your Sparkline will update once you have selected a new style/colour
Adjust the Group settings
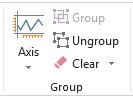
The Group objects give you the ability to adjust multiple settings within the sparkline. The main items I use within this group is the Ungroup and Clear buttons, let’s have a look at these features.
- From the Sparkline Tools > Design tab, locate the Group group
- Click the Axis button to see the options available
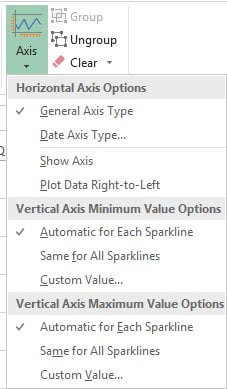
- By default, any new Sparklines will be set to General Axis Type
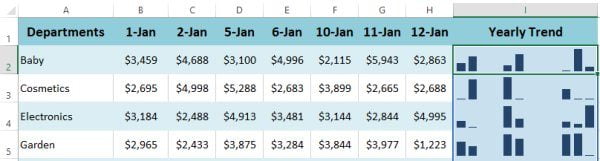
- If you are using data based on dates then select the Date Axis Type so that your Sparkline will demonstrate any gaps in your data based on dates. You will be prompted to select the data range containing the date values. In the example below, you can see the dates are 1, 2, 5, 6, 10, 11, 12 January. The data has gaps within the dates and by using the Date Axis Type you can now see corresponding gaps in the Sparkline.
- If there are any negative values in your data then you can click Axis > Show Axis so that it is easy to identify zero in the values
- You can also change the direction of the plotted data, click Axis > Plot Data Right to Left
- If you wish to adjust the scale of values shown in the Sparkline, you can do this using the Custom Value options for both the Vertical Axis Minimum Value Options and Vertical Axis Maximum Value Options
Group or Ungroup Sparklines
If you have created a sparkline using the AutoFill tool, this will have created a Sparkline group. Any formatting changes made to a Sparkline within the group will also be applied to other sparklines within the group. Whilst this does have its advantages you may want to be able to edit sparklines individually. You can do this by ungrouping sparklines from the main group. Vice versa, if you’ve created sparklines individually and wish to edit them as a group, you can group them together.
- Select the cell containing a sparkline which is part of a group
- From the Sparkline Tools > Design tab, click the Ungroup button
- If you click on any cell containing a sparkline which is still part of a group, you will see a blue line appear around the cell whilst any sparklines you have ungrouped will now have individual borders showing between each cell

Delete a Sparkline
Try deleting the sparkline! The Backspace or Delete button on the keyboard doesn’t work do they? To delete a Sparkline you will need to use the Clear button.
- Select the cell(s) containing a Sparkline you wish to delete
- From the Sparkline Tools Design tab select the Clear button and choose between Clear Selected Sparklines or Clear Selected Sparkline Groups
I hope these tips have been helpful for utilising the Sparkline feature within Excel. Sparklines provide an amazing way to visually represent trends within your data. Be sure to check out my other Excel based articles.